Anomaly based alerts
An Anomaly-based alert in SigNoz allows you to define conditions based on metric data and trigger alerts when the metric data deviates from the expected behavior. Here's a breakdown of the various sections and options available when configuring an Anomaly-based alert:
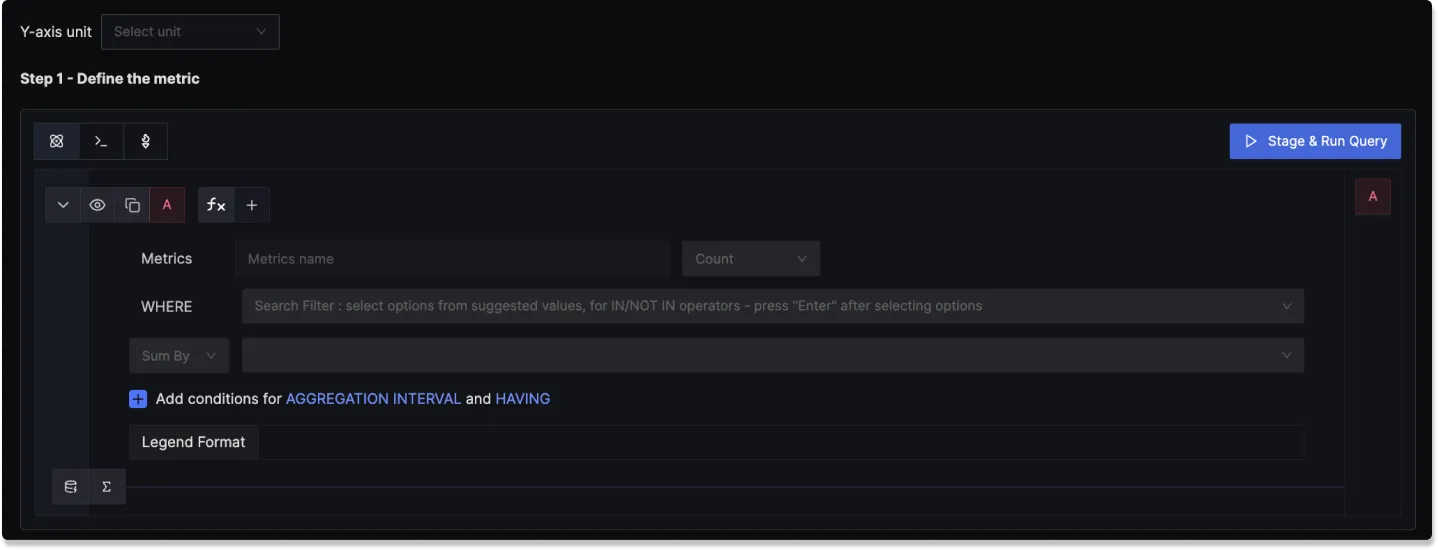
Step 1: Define the Metric
In this step, you use the Metrics Query Builder to choose the metric to monitor. The following fields that are available in Metrics Query Builder includes:
Metric: A field to select the specific metric you want to monitor (e.g., CPU usage, memory utilization).
Time aggregation: A field to select the time aggregation function to use for the metric. Learn more about time aggregation
WHERE: A filter field to define specific conditions for the metric. You can apply logical operators like "IN," "NOT IN".
Space aggregation: A field to select the space aggregation function to use for the metric. Learn more about space aggregation
Legend Format: An optional field to customize the legend's format in the visual representation of the alert.
Having: Apply conditions to filter the results further based on aggregate value.

To know more about the functionalities of the Query Builder, checkout the documentation.
Step 2: Define Alert Conditions
In this step, you define the specific conditions that trigger the alert and the notification frequency. The following fields are available:
Evaluation window: Specify the rolling time window for the condition evaluation. The following look back options are available:
- Last 5 minutes
- Last 10 minutes
- Last 15 minutes
- Last 1 hour
- Last 4 hours
- Last 1 day
Z-score threshold: Specify the Z-score threshold for the alert condition.
Condition: Specify when the metric should trigger the notification
- Above threshold
- Below threshold
- Above or below threshold
Occurrence: Specify how condition should be evaluated
- At least once
- Every time
Algorithm: Specify the algorithm to use for the anomaly detection. The following algorithms are available:
- Standard
Seasonality: Specify the seasonality for the anomaly detection. The following seasonality options are available:
- Hourly
- Daily
- Weekly
More Options :
Run alert every [X mins]: This option determines the frequency at which the alert is evaluated.
Send a notification if data is missing for [X] mins: A field to specify if a notification should be sent when data is missing for a certain period.

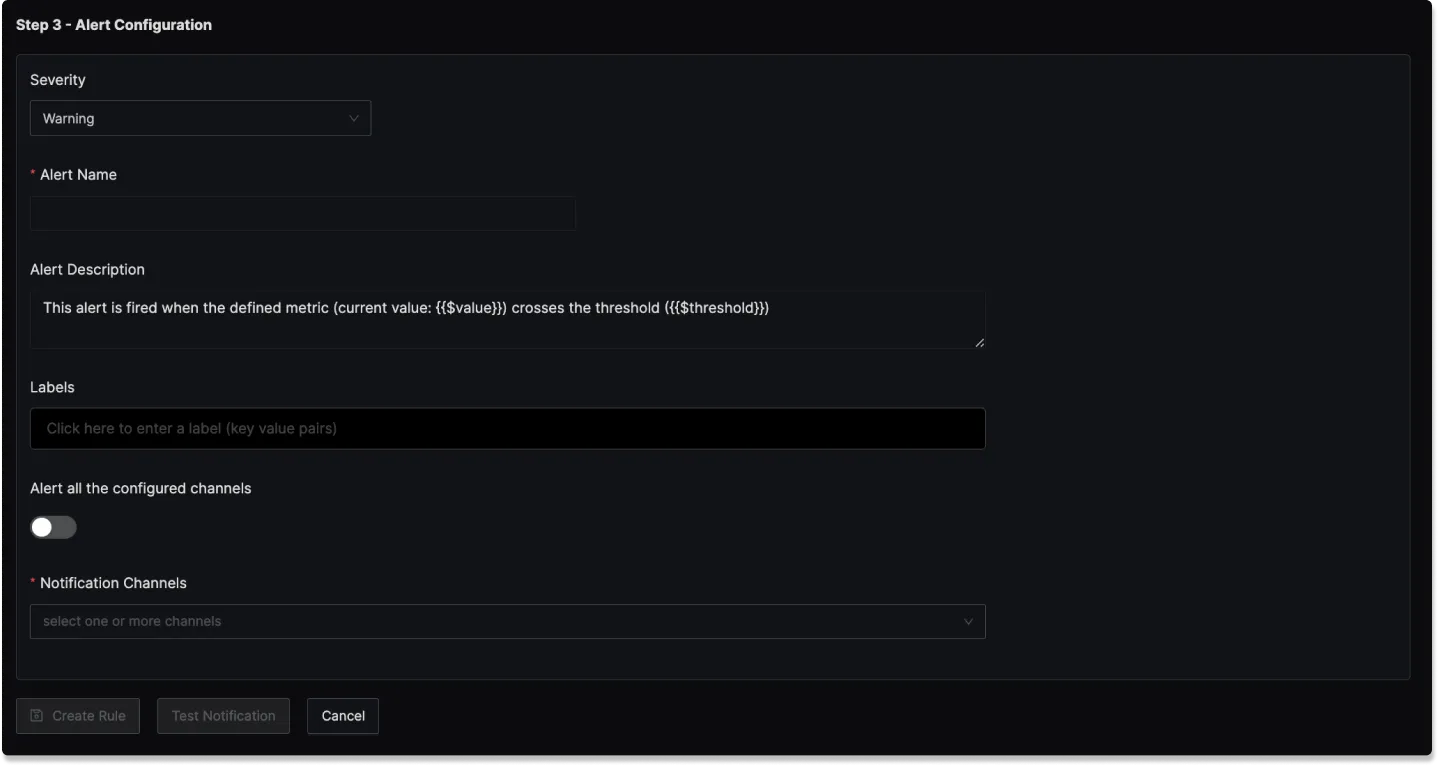
Step 3: Alert Configuration
In this step, you set the alert's metadata, including severity, name, and description:
Severity
Set the severity level for the alert (e.g., "Warning" or "Critical").
Alert Name
A field to name the alert for easy identification.
Alert Description
Add a detailed description for the alert, explaining its purpose and trigger conditions.
You can incorporate result attributes in the alert descriptions to make the alerts more informative:
Syntax: Use $<attribute-name> to insert attribute values. Attribute values can be any attribute used in group by.
Example: If you have a query that has the attribute service.name in the group by clause then to use it in the alert description, you will use $service.name.
Slack alert format
Using advanced slack formatting is supported if you are using Slack as a notification channel.
Labels
A field to add static labels or tags for categorization. Labels should be added in key value pairs. First enter key (avoid space in key) and set value.
Notification channels
A field to choose the notification channels from those configured in the Alert Channel settings.
Test Notification
A button to test the alert to ensure that it works as expected.

How It Works
Prediction Model
The system predicts expected values using the formula:
Predicted Value = Average(Past Period) + Average(Current Season) - Mean(Past 3 Seasons)
Where:
- Past Period: The immediate previous period (hour/day/week)
- Current Season: The current seasonal window up to now
- Past Seasons: Three consecutive previous seasonal periods
Seasonality Options
The system supports three types of seasonality:
- Hourly: For metrics that follow hourly patterns
- Daily: For metrics that follow daily patterns
- Weekly: For metrics that follow weekly patterns
Time Windows
Based on the selected seasonality, the system analyzes:
- Current Period: The window you're analyzing (e.g., last 5 minutes)
- Past Period: Previous period with 5-minute offset
- Hourly: last hour
- Daily: last day
- Weekly: last week
- Seasonal Windows: Multiple seasonal periods for trend analysis
- Current Season
- Past Season
- Past 2 Seasons
- Past 3 Seasons
Anomaly Score Calculation
- Standard Deviation: Calculated from the current season's data
- Anomaly Score:
|Actual Value - Predicted Value| / Standard Deviation - Bounds:
- Upper Bound = Moving Average(Predicted) + (z-score × Standard Deviation)
- Lower Bound = Moving Average(Predicted) - (z-score × Standard Deviation)
Best Practices
Choosing Seasonality
- Select based on your metric's natural cycle
- Consider business patterns and user behavior
- Start with the most obvious pattern (e.g., daily for most business metrics)
Setting Z-Score Threshold
- Default: 3 (catches significant anomalies)
- Lower for more sensitive detection
- Higher for fewer false positives
Time Window Selection
- Use appropriate intervals based on metric volatility
Limitations and Considerations
Data Requirements
- Needs at least 4 seasonal periods of historical data
- More historical data improves prediction accuracy
- Missing data points may affect accuracy
Sensitivity
- May be sensitive to sudden seasonal pattern changes
- Requires tuning for metrics with high variability
- Consider business context when setting thresholds
Examples
1. Web Traffic Monitoring
- Seasonality: Daily
- Use Case: Detect unusual spikes or drops in website traffic
- Benefits: Accounts for daily patterns (work hours vs. off hours) while adapting to growth trends
2. Weekly Business Metrics
- Seasonality: Weekly
- Use Case: Monitor business KPIs (sales, signups)
- Benefits: Accounts for weekly business cycles and seasonal trends
